Image by: Andrew Shipley
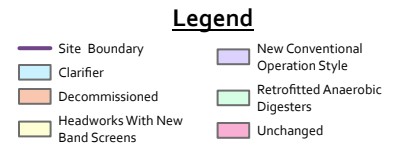
The oxidation ditches for Plants 4 and 5 will be converted to a new conventional operational style with an anaerobic denitrifying zone. Each plant will be divided into two separate tanks. The return activated sludge (RAS) flow rate will be adjusted to 75% and the waste activated sludge flowrate will be changed to accommodate the RAS rate. Each tank will run four of its rotors as aerators to supply oxygen for nitrification, while the rest will be submerged to move flow through the anaerobic zone. With these changes it estimated there will be an effluent total nitrogen concentration of 6.6 mg/L, below the permit level of 8 mg/l. It is expected that almost all of the soluble BOD will be consumed and removed. Under these conditions it was determined that the secondary clarifiers would be slightly overloaded, but it was determined that it would be more cost effective to delegate more stress on the disk filters and replace them more often than retrofit the clarifiers. A summary of the operational parameters as well as a diagram of the proposed changes can be found below.
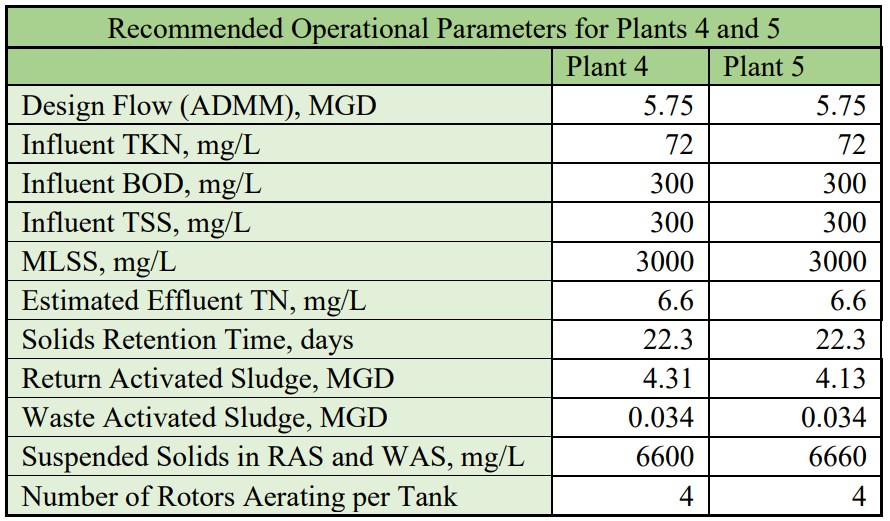
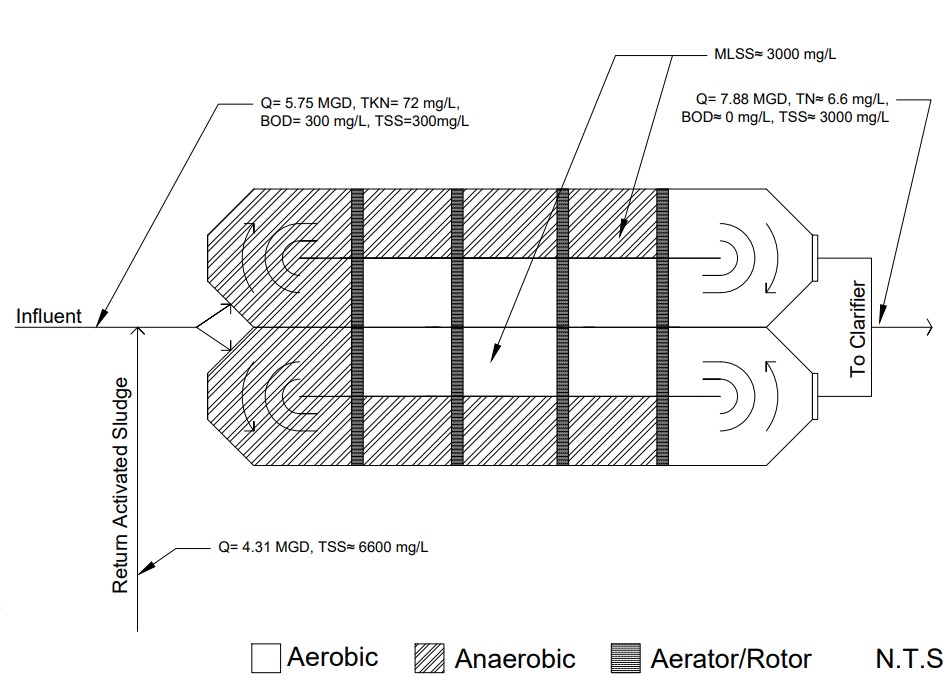
Image by: WCWW
The volume of the existing aerobic digestors would allow for 225 cubic meters of sludge per day to be digested once they were retrofitted to anaerobic digestors. This would produce around 340 cubic meters of methane per day, which once sold could generate $157,000 in revenue. The construction would require the instillation of: a heat exchanger, mixing system, gas collection system, and air scrubber. The system could be operated at 35 degrees Celsius and it was determined that there would be sufficient methane produced to heat the system and turn a profit. A table showing recommended design parameters as well as diagrams of the digestors can be seen below.
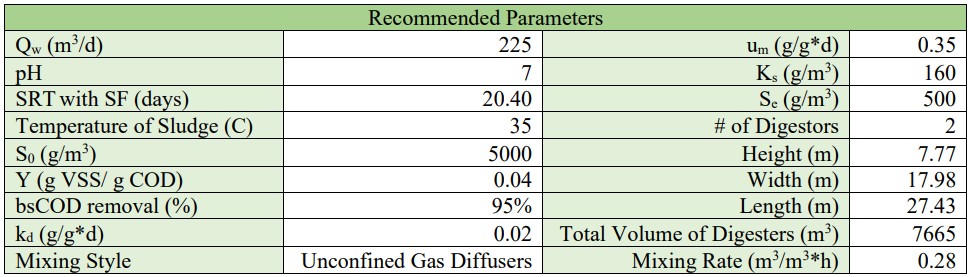
Image by: WCWW
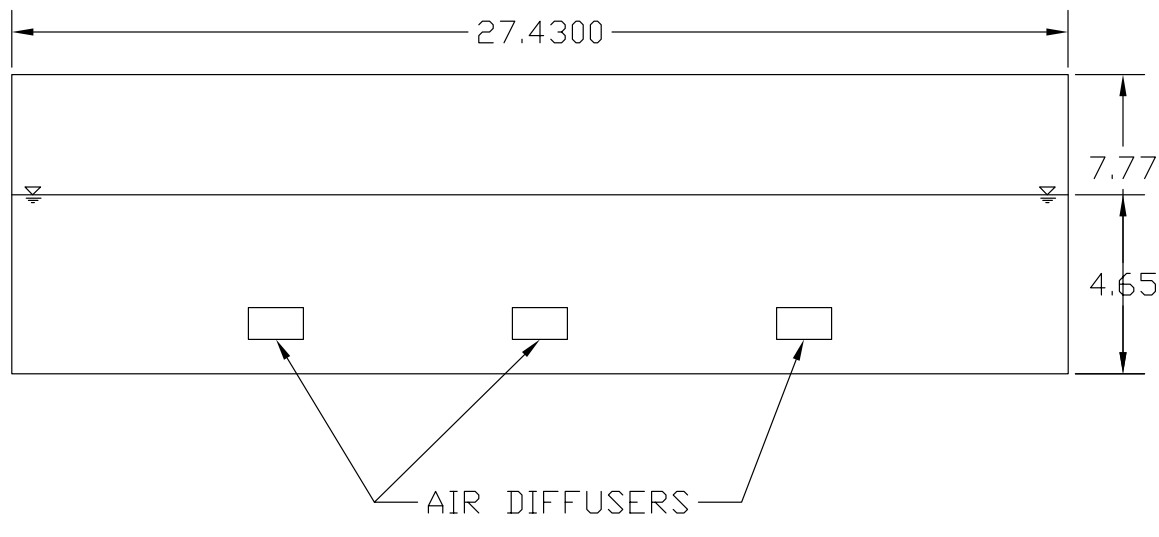
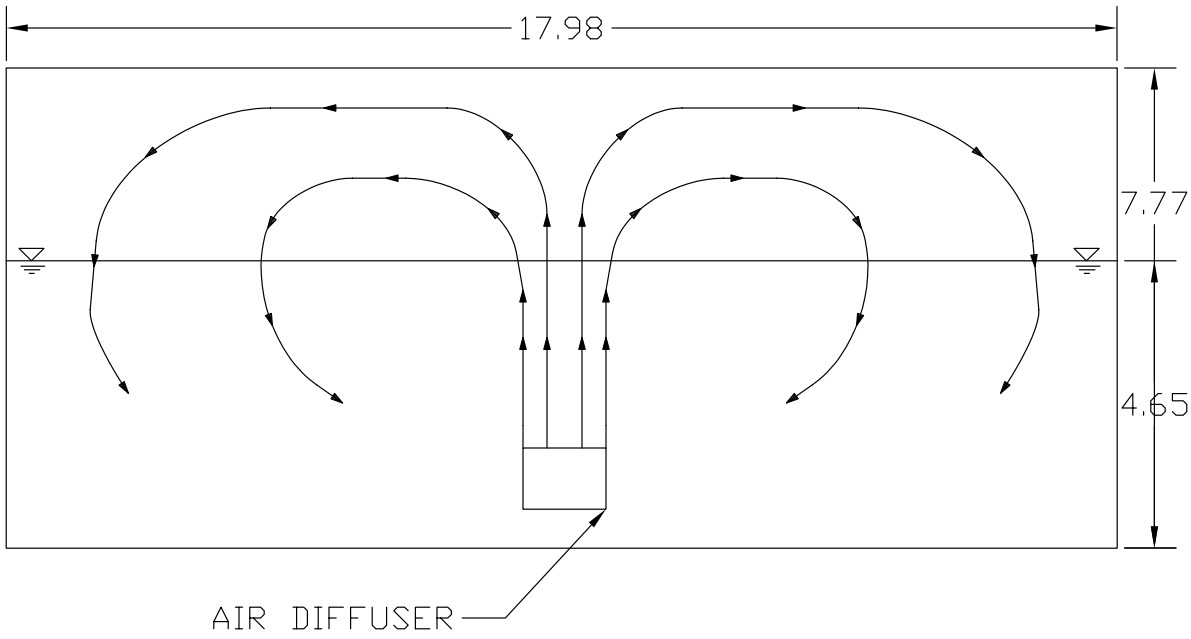
Image by: WCWW
Hydraulic analysis was performed with the goal of developing a hydraulic profile. Firstly, head loss within and between each major treatment process was calculated. Excel’s “goal seek” function was also used to solve for the depth of flow in the open channel troughs leading to secondary treatment. Design and peak flow water surface elevations were known in a few locations throughout the treatment process from design calculations, given data, and assumptions. The rest of the water surface elevations were found from adding and subtracting calculated head loss values from known points in the treatment process. Once the water surface elevations were obtained, a hydraulic profile was created in Civil 3D showing the entire SPA 1 WRF from the influent pump station to the disinfection basins. This analysis was able to confirm that the existing hydraulic infrastructure would be able to handle the increased capacity without requiring any changes. The hydraulic profile can be found below.
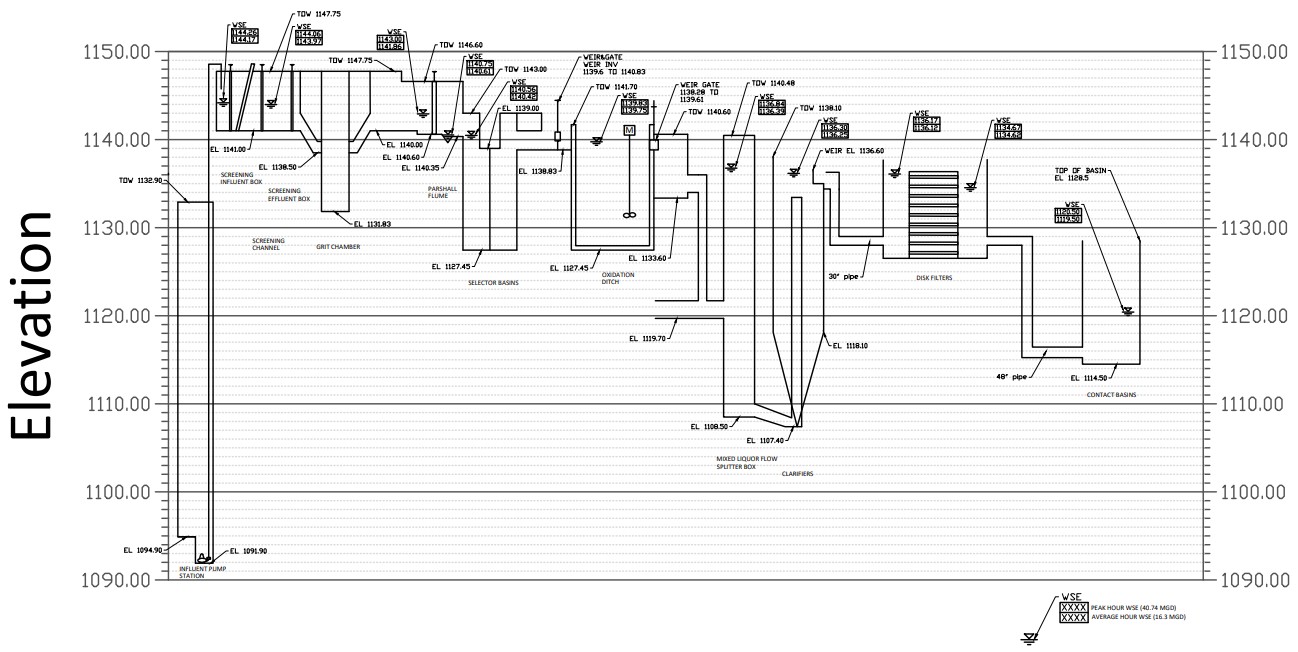
Image by: WCWW
Image by: WCWW
Image by: WCWW