Our project was completed over the course of two semesters at Northern Arizona University. The first semester, the class in which the project was assigned to our group was CENE 476. The class in which the final design was due was CENE 486. A summary of the work conducted during those two semesters is described below.
For this class, a project proposal was compiled an submitted. For the proposal, we met with our client to discuss his concerns and expectations and we met as a group to discuss our experience in related fields. Our proposal included our work history and an expected engineering cost. The final proposal paper can be viewed by clicking the link below. Also shown below is a link to the PowerPoint presentation used in class to present our proposal.
Final Proposal Paper
Proposal PowerPoint
First Site Visit: On October 6th, 2006, we met with our client for the first time. Our consultant John Meade introduced us to our client and to the area. We were shown where the expected site would be, but did not go out to it on this trip. We also visited a wastewater treatment site at Kykotsmovi Village, nearby, which is very similar to what the client expects for his site.
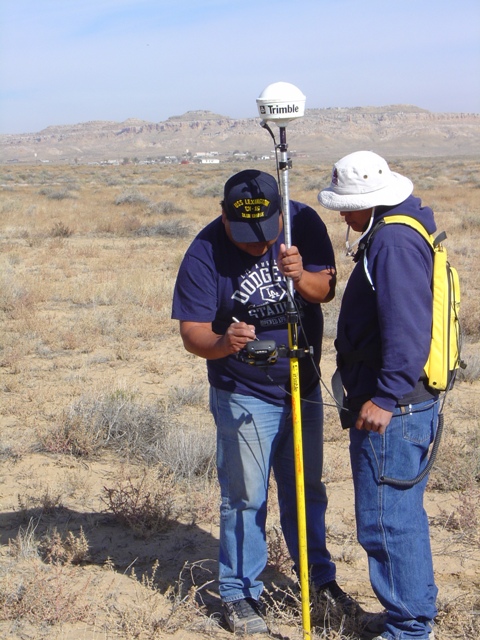
Second Site Visit: On November 3rd, 2006, we met with our
client at the village again. He drove us out to the proposed site and he
brought a Land Information Systems surveyor with him. The surveyors took a
few shots by GPS so that we could locate our proposed site on a map. The
picture to the left shows the surveyors from Land Information System working at
the site, using GPS.
In the CENE 486 section, the research phase continued. We looked into alternatives and met with our technical advisor Mike Stover to discuss our findings. Deliverables for the class were a 30% completion report, a 60% completion report, a 90% completion report, and a final design report. These reports can be viewed by clicking the links below. The 30% report is included in the 60% report.
60% completion report
90% completion report
The steps we took in designing the treatment system are explained below:
Phase I
Data was collected from our client and our technical advisors.
Calculations were performed to estimate projected population, current water usage,
and future water usage. This was the basis of our "design flow", which was
used in further calculations.
Phase II
The preliminary calculations were performed to size the Oswald alternative and
the Lagoon Alternative, using the design flow. These calculations, advice from
Mike Stover, and the preferences of the client were taken into consideration
when choosing the appropriate primary treatment alternative. On April
14th, 2007, our client met with us in Flagstaff to review our preliminary
drawings and to select the evaporation design. He was presented with a
hand sketch of our alternatives, including the pro's and con's, and selected the
evaporative channel design instead of the evaporative basin design.
Phase III
After the calculations were done and the design alternative was finalized,
drafting began. Drafting was completed at Civil Design & Engineering,
Inc., with the help of Christine Laguna.
Phase IV
The final phase of the project design was to prepare a PowerPoint presentation,
a website, and a poster presenting our design. The presentation will be
given at the DuBois Center on April 27th, 2007 at 10:30 in the morning.
Our client intends to attend this presentation and will be able to view and
discuss our design at that time. Our client will also be presented with a
copy of the final design report when it is completed.
Excel Spreadsheets, scanned pages and CAD drawing supporting our design can be found by following the links on the next page.
![]()
![]()
![]()