The first phase of development focused on gaining access to the historical campus energy data and preparing it for analysis. Once the data pipeline was established, we experimented with several machine learning approaches and ultimately trained a Random Forest Regression model to generate short-term energy forecasts. This phase allowed us to understand baseline energy patterns and establish a reliable forecasting workflow.
The second phase centers on integrating our model’s predictions into a local isualization tool. Instead of optimizing energy usage directly, this phase emphasizes clarity and insight, turning raw forecasts into meaningful information. We highlight predicted high-load periods, enabling users to quickly see when demand is expected to peak and how energy usage shifts over time.
In the final phase, we are working toward integrating our forecasting and peak-identification results into Willow’s ecosystem using ONNX. The goal is to ensure our model can run efficiently within their platform and support future decision-making workflows. While we are not directly controlling building systems, this phase focuses on delivering actionable insights that facility teams could use for planning, load management, or future optimization efforts beyond the scope of this capstone.
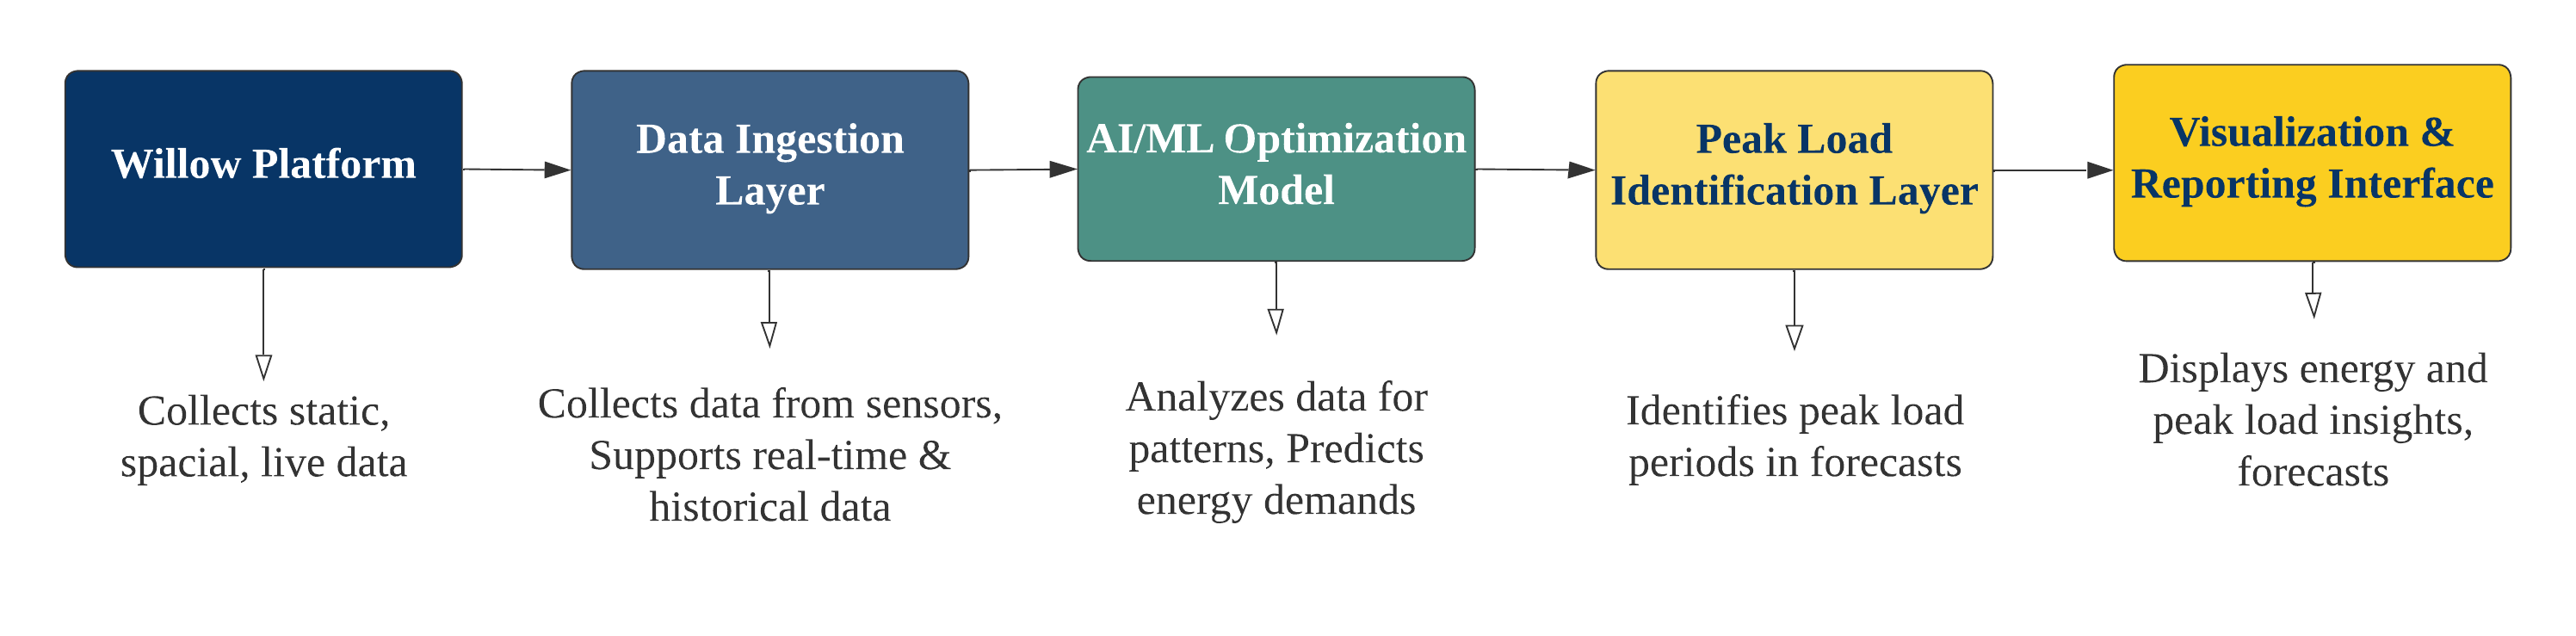
This workflow illustrates how data moves through the WillowWatt system: from the Willow platform, to data ingestion, to our forecasting model, and finally into peak-load identification and visualization. Each layer plays a specific role in transforming raw building data into meaningful insights. Our model analyzes historical patterns, predicts energy usage, identifies peak load periods, and prepares those insights for display through intuitive visual reporting. This flow represents the full path from real-world data to actionable energy insights.
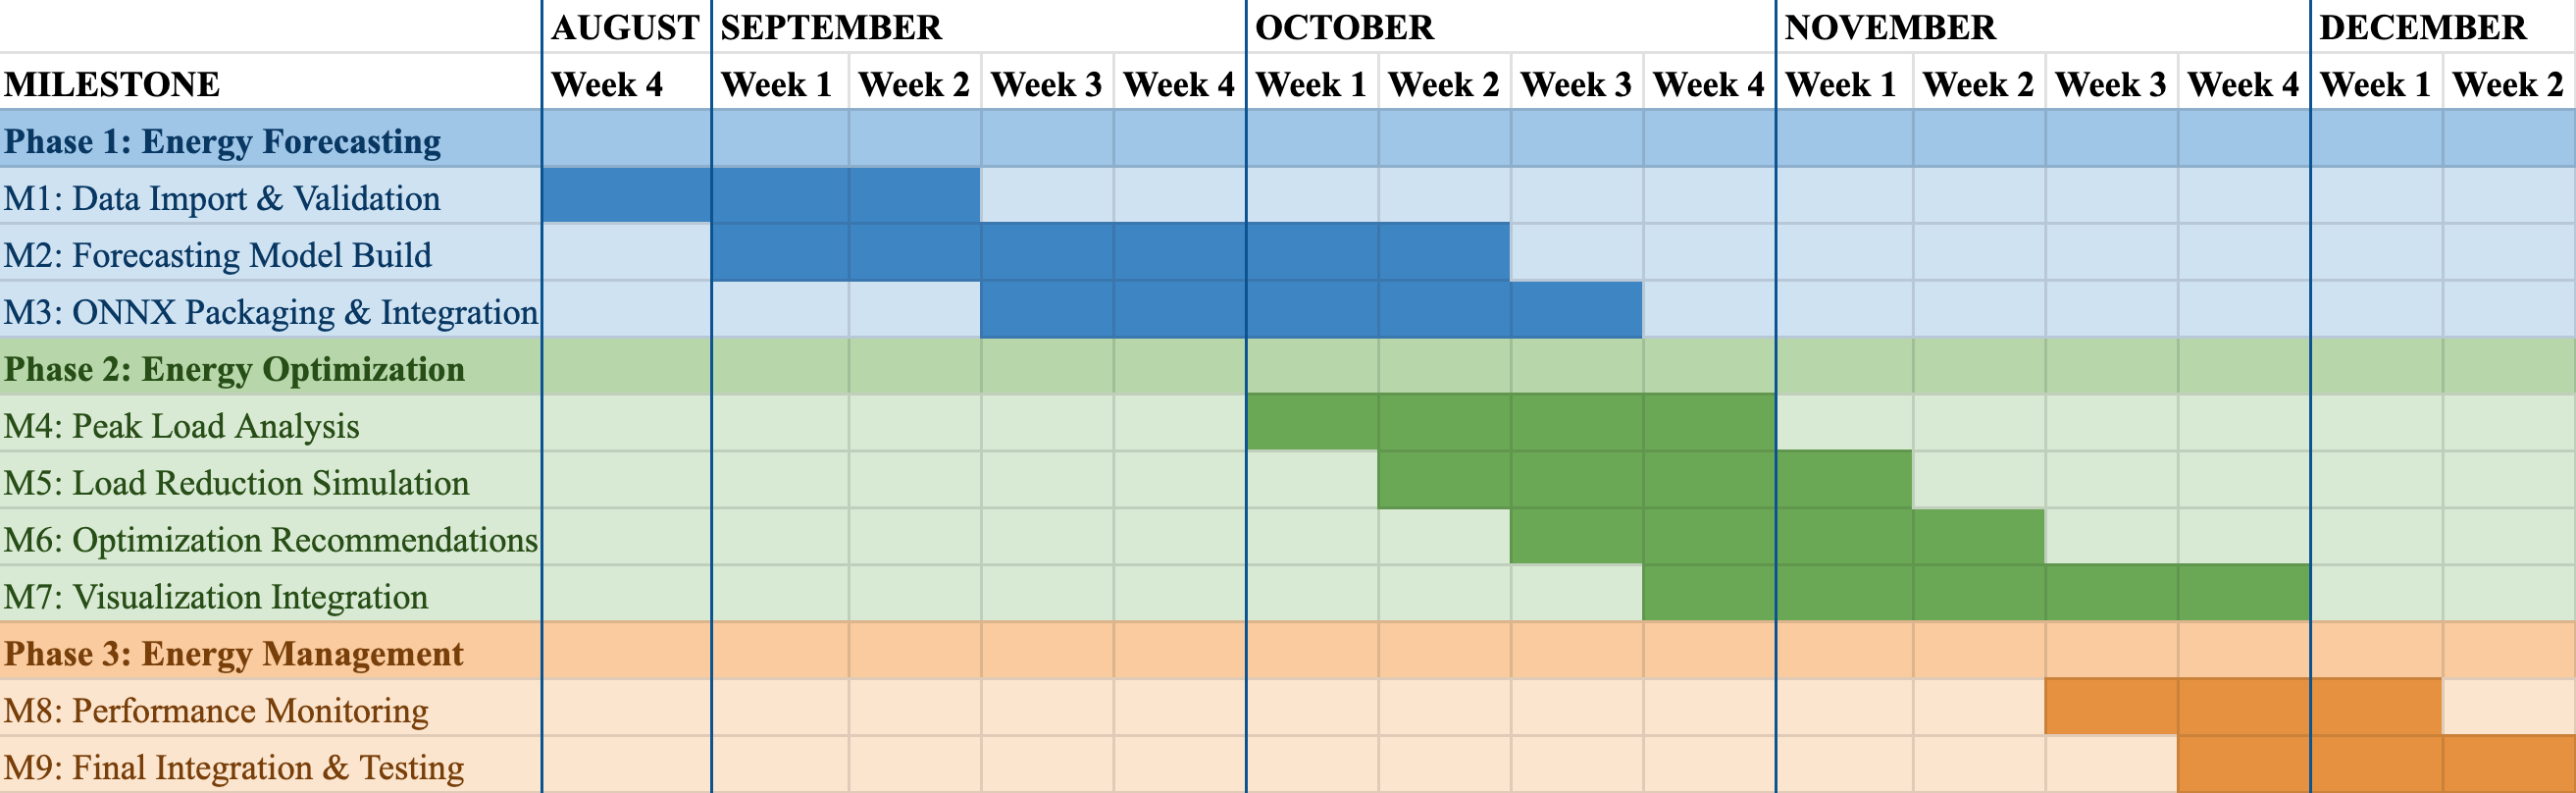
This timeline outlines the major milestones for WillowWatt over the course of the academic year. It shows how our work progresses from early forecasting development, through peak-load identification and simulation, and into final integration and testing. Each phase builds on the one before it, reflecting how our system becomes more capable and aligned with Willow’s platform over time. The timeline also highlights our team’s steady pace and the careful sequencing of tasks needed to train, evaluate, and integrate our model effectively.