proposed Gantt Chart
The Gantt Chart shows CJE's proposed schedule for CENE 486C and the AZWater SDC. In red shows CJE's critical path. CJE will follow the schedule to ensure that all task needed to complete the project will be done on time.
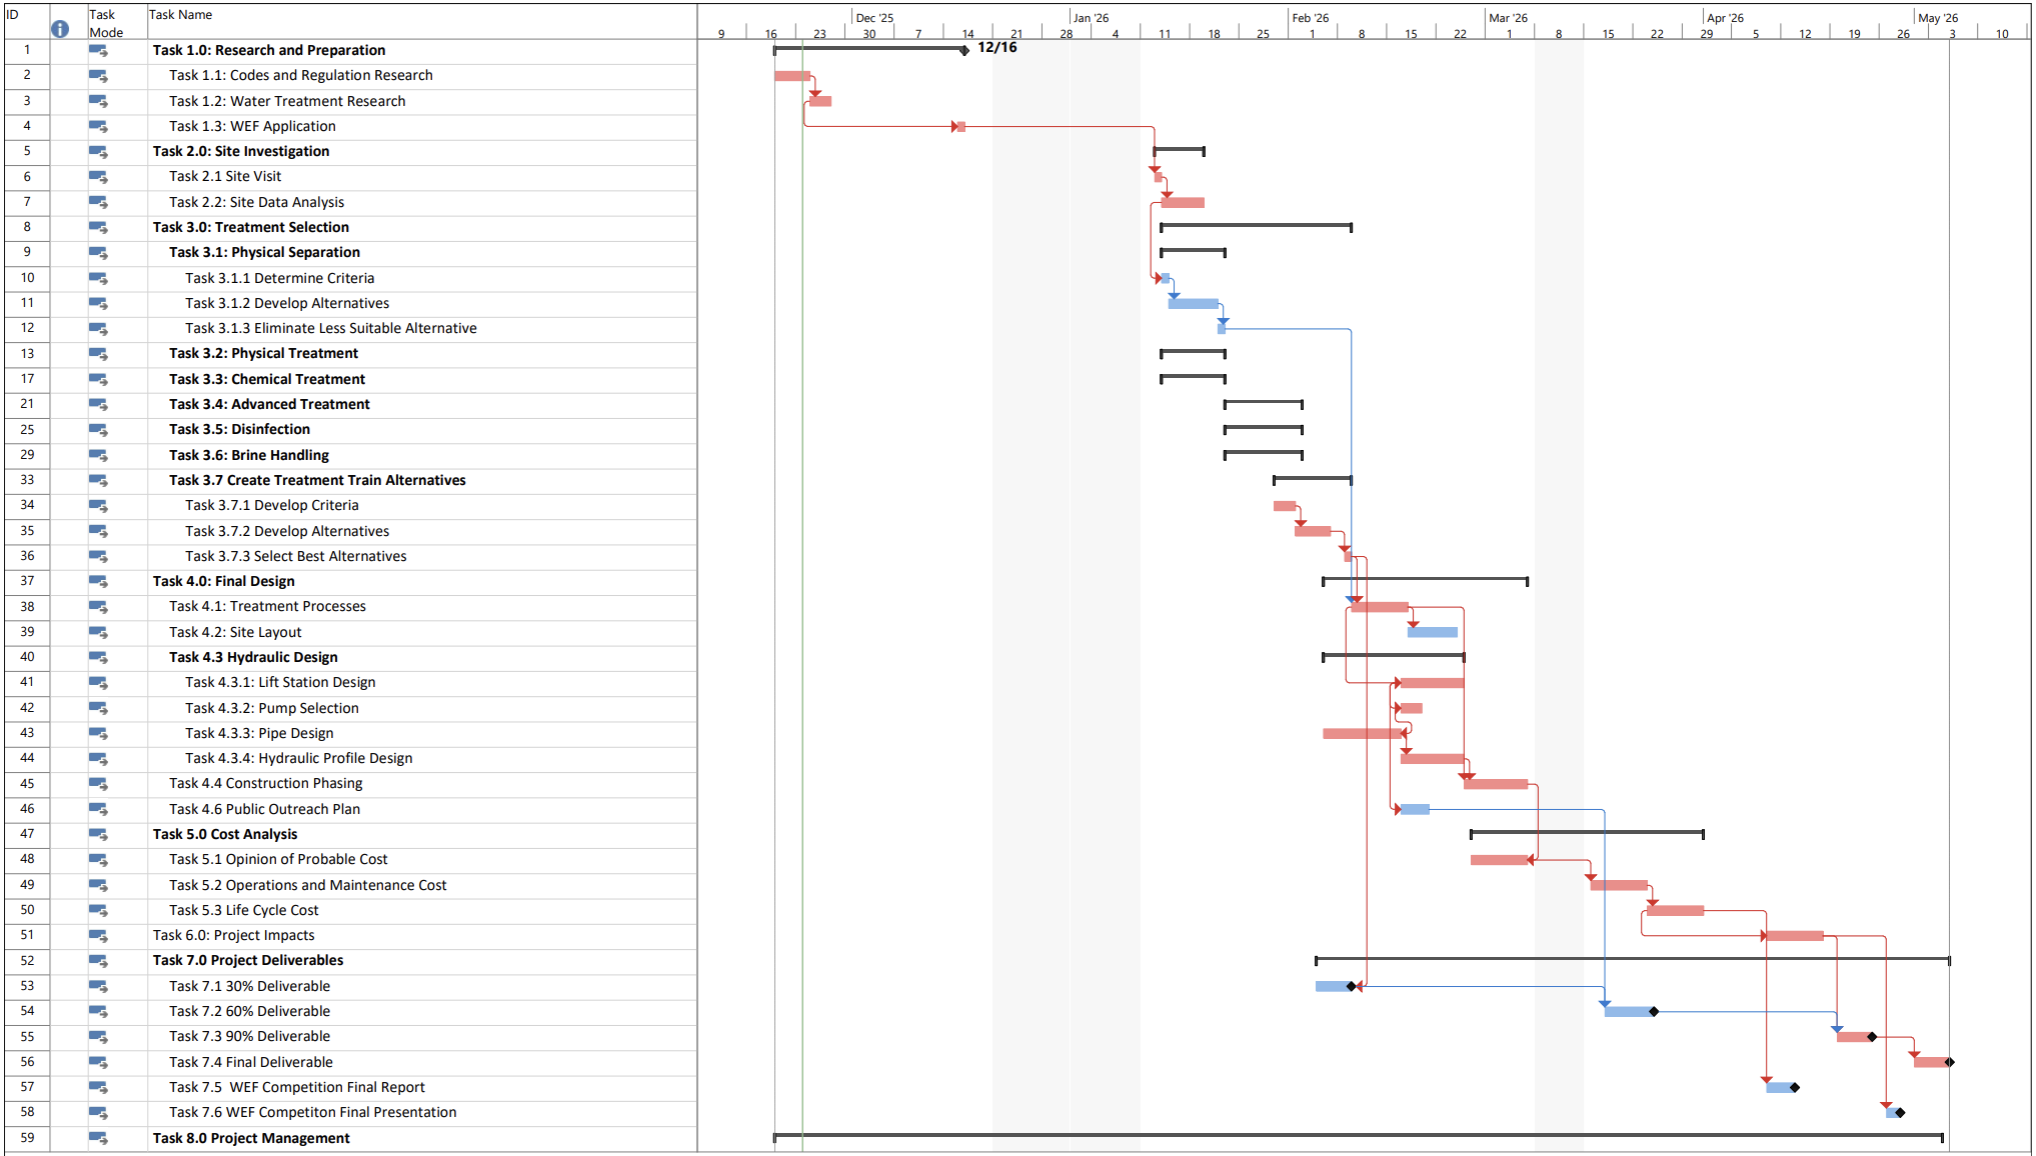
Figure 1: Proposed Gantt Chart
To download Gantt Chart click here
actual Gantt Chart
The Gantt Chart shows CJE's actual schedule for CENE 486C and the AZWater SDC. In blue shows CJE's critical path. CJE followed the schedule to ensure that all task needed to complete the project was done on time.
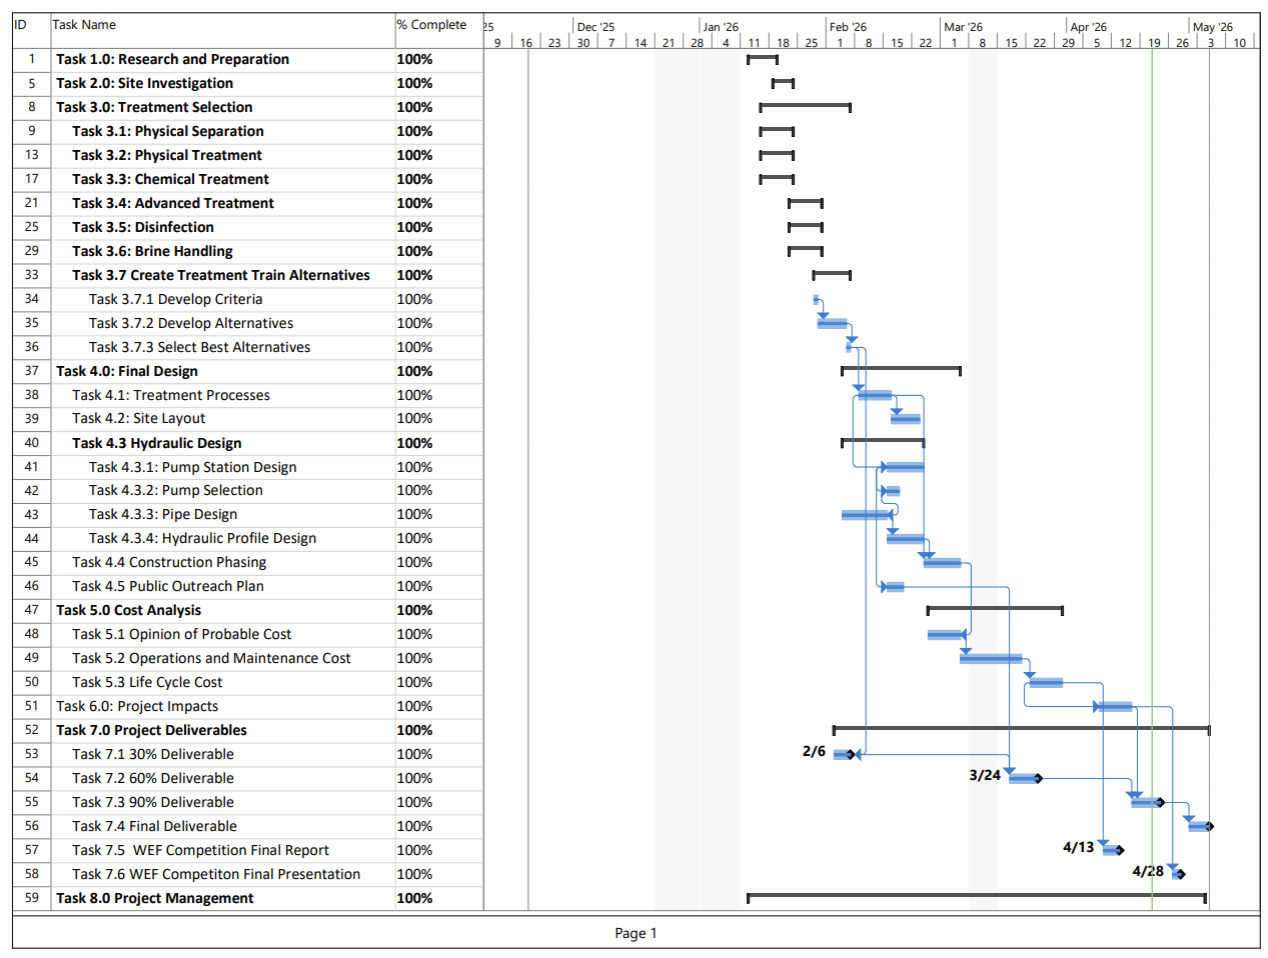
Figure 2: Actual Gantt Chart